Saturday, September 11, 2021

4.1    Potentiodynamic polarization and weight loss techniques :

Corrosion rates and inhibition efficiency using potentiodynamic and weight loss technique  for AISI-1020 in 3% NaCl solution   at 25 ºc , in the absence and presence of different concentrations of aromatic hydrocarbon and quaternary amine are listed in the next table .


Table: Corrosion rate and inhibition efficiency using potentiodynamic and weight loss technique for AISI–1020 in 3% NaCl solution at 25 ºc in the absence and presence of inhibitors.


Potentiodynamic  Polarization Technique :

From the polarization behavior of carbon steel at different concentrations of Quaternary Amine inhibitor and Aromatic Hydrocarbon in 3%NaCl solutions at 25˚C which are shown in figure a. and fig b respectively. The current densities on the anodic polarization curve were significant reduced as inhibitor concentration is increased. Generally, the inhibition was of a mixed type.  The suppression of the anodic process being greater.

figure .a: polarization curves for AISI 1020  in 3% NaCl solution in the absence and presence of quaternary amine at 25 ºC.


        Figure b: polarization curves for AISI-1020 in 3% NaCl solution in the absence and presence of Aromatic Hydrocarbon at 25 ºc


                                           By comparing the last two figures  quaternary amine inhibition is more effective than aromatic hydrocarbon in 3%NaCl solutions.The measured (corrosion rate) CR by the potentiodynamic method of AISI  1020 carbon steel specimen in saltwater solution as a function of corrosion inhibitor concentration (quaternary amine) is shown in the following fig E.

Fig c

Effect of Aromatic Hydrocarbon inhibitor concentrations on the corrosion rate of AISI 1020 carbon steel at 25oC using the potentiodynamic method is indicated in fig c.


Fig d

Effect of aromatic hydrocarbon  and quaternary  amine  inhibitor concentration on the  corrosion rate of AISI-1020 carbon steel in 3% NaCl solution at 25 °c  using potentiodynamic technique indicated in fig d.


Fig E


It is clear from figures c and d that the corrosion rate (CR) is decreased with increasing inhibitor concentration and in figure e the corrosion rate (CR) is reduced  more when using Quaternary Amine than Aromatic Hydrocarbon at all concentrations.


 Weight loss measurements :

 The mild steel unmounted cylindrical steel samples with 1cm2cross section area and 1cm height washed with acetone using an ultrasonic cleaner. Surface preparation is handled by using abrasive paper of 320, 600, 800, 1000 grade. Then the samples dried and weighed before immersion in solutions of 3%NaCl solution in the absence and presence of inhibitors for recording weight loss measurements. The results were indicated before in table 1.

The effect of organic inhibitors  “Quaternary Amine and Aromatic Hydrocarbon”  concentrations on the corrosion rate of carbon steel AISI 1020 at 25oC using weight loss technique is indicated in fig f, g


Figure f indicates the corrosion rate of mild steel AISI 1020 as a function of the concentration of both quaternary amine and aromatic hydrocarbons corrosion inhibitors.


It is clear from the figure 4 , 5 and table 2 that the measurements of potentiodynamic technique are the same as weight loss technique , both the corrosion rates decreases by increasing inhibitor concentration because the exposed surface area decreases by forming a film by corrosion inhibitors and the covered surface increases by increasing the inhibitor efficiency .


4.2    Scanning Electron Microscope (SEM)

a

SEM images for the AISI 1020 in 3% NaCl solution saturated  at 25˚C for one week in the absence of inhibitors, presence of 50 ppm Quaternary Amine and 20 ppm Aromatic hydrocarbon are shown in Figures 4.13a, b and c, respectively. As observed from Fig. 4.13a, corrosion appeared on the metal surface in the form of scattered pits, while in Figures 4.13b and c, most of corrosion pits disappeared from the metal surfaces due to the presence of inhibitors.


b

c


Figure 4.13: SEM images for AISI 1020 in 3% NaCl solution at 25˚C for

One week  in the absence of inhibitors (a), presence of 50 ppm Quaternary amine(b)

20 ppm Aromatic hydrocarbon  (c)

4.3    Energy Dispersive X-ray Analysis (EDX)

Figures 4 a, b and c show the EDX spectrum for the AISI 1020 in 3% NaCl solution  at 25˚C for one week in the absence of inhibitors, presence of 50ppm Quaternary Amine  and presence of 20 ppm Aromatic hydrocarbon, respectively. Tables 4 a, b and c reflect data obtained from the related spectrums for each element on the metal surface. In the absence of the inhibitors, the EDX spectra show the characteristics peaks of some of the elements constituting the AISI 1020 sample.

In inhibitor containing solutions, the EDX spectra showed an additional line characteristic for the existence of nitrogen (N). In addition, the intensities of carbon (C) and oxygen (O) signals are enhanced. The appearance of the N signal and this enhancement in the C and O signals upon adding inhibitors to the solution is due to the N, C and O atoms of the adsorbed compounds as shown in fig 4 a , b & c. These data show that a material containing N atoms has covered the metal surface. This layer is undoubtedly due to the inhibitor, because of the existence of N signal and the high contribution of the C and O signals observed in presence of the inhibitors.

The N signal and this high contribution of the C and O signals are not present on the metal surface exposed to uninhibited solutions . The spectra show also that the Fe peaks are considerably suppressed relative to the specimens inserted in the uninhibited solution. The suppression of the Fe lines occurs because of the overlying inhibitor film. These results confirm those from electrochemical measurements which suggest that a surface film inhibits the metal dissolution, and hence retarded the hydrogen evolution reaction. Therefore, EDX examinations of the metal surface support the results obtained from electrochemical methods that quaternary amine and aromatic hydrocarbon are good inhibitors for AISI 1020 carbon steel in 3% NaCl solution . It is appeared from the results that the amount of N atoms adsorbed on metal surface in the presence of quaternary amine is higher than that of aromatic hydrocarbon which may be due to the formation of thicker film and so, higher inhibition efficiency .

b

a

c

Figure 4.14: EDX Spectrum for the AISI 1020 in 3% NaCl solution at 25˚C for

One week  in the absence (a), presence of 50 ppm quaternary amine (b) and 20 ppm  aromatic hydrocarbon (c)

Table 4.8: Data obtained from EDX for the AISI 1020 in 3% NaCl solution  in the absence (a), presence of 50 ppm quaternary amine  (b) and 20 ppm of aromatic hydrocarbon (c)


Element

Weight %

Atomic %

Net Int.

Table 3. a

C K

1.74

5.69

36.90


O K

11.81

29.05

1064.70


NaK

3.28

5.62

132.00


ClK

2.44

2.71

465.80


MnK

0.60

0.43

57.30


FeK

80.14

56.50

6036.10

O %

Element

Weight %

Atomic %

Net Int.

C K

23.50

38.44

55.50

N K

13.45

18.86

16.80

O K

20.20

24.81

61.90

NaK

5.38

4.60

23.30

ClK

0.56

0.31

8.50

MnK

0.78

0.28

5.40

FeK

36.12

12.70

195.40


                          Table 3. b


O %

N %


Element

Weight %

Atomic %

Net Int.

C K

0.00

0.00

0.00

N K

5.42

11.77

4.10

O K

17.88

33.98

36.90

NaK

14.25


18.85


19.20


ClK

4.43

3.80

23.20

MnK

3.36

1.86

8.40

FeK

54.65

29.75

110.30


                           Table 3. C


4.4    X-Ray Diffraction Analysis (XRD)Low Angle

Figure 4.15 a shows the XRD pattern for the AISI 1020 carbon steel specimen after immersed in 3% NaCl solution saturated  at 25˚C, while Figures 4.15b and c show the specimen after immersion in 50 ppm quaternary amine and 20 ppm aromatic hydrocarbon inhibitors, respectively. Figure 4.15 a shows the formation of oxonium aqua iron chloride (H3O) 2 FeCl5 (H2O) and goethite (Fe2O3.H2O) on the metal surface and iron in the core. These compounds represent the corrosion products due to immersion in the test solution. Intensity of these compounds is much higher on the metal surface as indicated by the related peaks.

Figure 4.15 b and c show the formation of iron nitride complex compounds on the metal surface and iron in the core. Iron nitride compounds represent the protective film formed due to interaction of iron with the inhibitor molecules. Intensity of these compounds is much higher on the metal surface as indicated by the related peaks and percent of more than (50%) which mean that the metal surface is composed mainly of iron nitride compounds. Also, narrow peaks of these compounds indicated that the formed films have crystallized character. This led to increase in the level of protection which is also, confirmed by the absence of corrosion products in the pattern in the presence of iron nitride compounds.

Nitride coatings have been used in numerous applications to increase the hardness and improve the wear and corrosion resistance of structural materials, as well as in various high-tech areas, where their functional rather than mechanical properties are of prime importance .


Figure 4.15 a: XRD pattern for the AISI 1020  specimen after immersion in 3% NaCl solution  at 25˚C for  one week

Figure 4.15 b: XRD pattern for the AISI 1020 specimen after immersion in 3% NaCl solution and 50 ppm quaternary amine at 25˚C for one week


Figure 4.15 c: XRD pattern for the AISI 1020 specimen after immersion in 3% NaCl solution and 20 ppm aromatic hydrocarbon at 25˚C for one week


Monday, September 6, 2021


Nanoparticles: Properties, applications and toxicities:

Corrosion Inhibition of Magnesium in Safe and Unsafe Electrolytes

 Corrosion inhibition of magnesium in safe and unsafe electrolytes 

Experimental work 
 Materials 

The material used in this study was 99.54 % magnesium.  It was received in blocks. The block was cut into specimens with an area of 1 cm2 cross section and 1 cm height. The analysis of the used magnesium was conducted by X-ray fluorescence (XRF) 

Specimen preparation:    

 Specimens with 1cm height and 1cm2 cross-sectional area was mounted in epoxy resin and the surface of the specimens were grounded with emery paper up to 2000 grit, the specimens were carefully cleaned with distilled water rinsed with acetone and dried under air.

Anodizing electrolytes 

 The electrolyte was prepared at room temperature with distilled water with 3M potassium hydroxide, 1M Sodium Silicate and 0.6M potassium silicate concentrations as PH of 13. 

Anodizing Cell Anodizing process was carried out at room temperature using a two-electrode cell and a DC power supply figure 3.2. The electrolytes of 200 ml volume were contained in a glass cell. The anode was the magnesium specimen while the cathode was a stainless steel bar. The samples were anodized under constant voltage of 5 V for 10, 20 , 30 , 40 , 50 minutes. The film formed on the surface was rinsed with distilled water and dried in warm air. 

Results and Discussion

 Contact angle measurements

 The contact angle was measured at different anodizing times for 3M potassium hydroxide, 1M sodium silicate, and 0.6M potassium silicate solutions. As indicated in the figure  it reaches 114o,105o,113o for 30 minutes anodizing in 3M potassium hydroxide, 1M sodium silicate, 0.6M potassium silicate respectively. That proves that a hydrophobic layer is formed on the surface of the substrate.   

                               The effect of anodizing time on the contact angle

Polarization measurements

Results of corrosion rate determination by linear polarization techniques table (4.1) are in good agreement with contact angle measurements  i.e the condition which gives the highest contact angle showed the lowest corrosion rate. Polarization  curves figure (4.2)  of the specimens anodized in 3M potassium hydroxide, 0.6M potassium silicate, 1M sodium silicate solutions for 10, 20, 30, 40, and 50 minutes were shifted to the positive direction  i.e it became nobler, and at the same time shifted to the left relative to the unanodized specimen indicating  less dissolution.

The electrochemical corrosion parameters which are listed in the table (4.1) indicate that the corrosion rate decreased from 36.8 mpy for pure Magnesium to 7 mpy with an efficiency of 81.02% for 30 minutes anodizing in 3M potassium hydroxide electrolyte and decreased to 2.27 mpy  with an efficiency of 93.84% for 30 minutes anodizing in 1M sodium silicate electrolyte also decreased to 1.38 mpy  with an efficiency of 96.25% for 30 minutes anodizing in 0.6M potassium silicate electrolyte. 

Potassium silicate electrolyte has given us better corrosion resistance than using sodium silicate electrolyte besides having good safe environmentally friendly properties.


Potentiodynamic polarization curves  for pure magnesium and anodized specimens  in  (a)3M potassium hydroxide (b)1M sodium silicate (c)0.6M potassium silicate electrolytes for 10,20,30,40 and 50 minutes. 

Results of linear polarization experiments for anodized specimens in 3M potassium hydroxide,1M sodium silicate and 0.6M potassium silicate electrolytes for 10,20,30,40 and 50 minutes . 


X-ray Diffraction  :

Figure (4.3) illustrates an X-ray diffraction patterns results of  formed films after anodizing for 30 minutes using anodizing electrolytes  3M potassium hydroxide, 1M sodium silicate and 0.6M potassium silicate  respectively .

As shown in figure (4.3) MgO and Mg(OH)2  were the main phases formed during anodizing; It is clear that the MgO amount was larger than that of Mg(OH)2. The intensity of the peaks of MgO produced in the potassium hydroxide solution was strong owing to the thick film produced. While in the case of 1M Sodium Silicate solution the dominating phase is Mg2SiO4 (2MgO.SiO2).  For 0.6M potassium silicate solution the dominating phase is also  Mg2SiO4 (2MgO.SiO2). Both anodized films using sodium silicate and potassium silicate are partially structured with a glassy morphology as indicated in the figure. The intensity of the peaks of Mg2SiO4(2MgO.SiO2) produced in sodium silicate solution was similar to that produced in 0.6M potassium silicate solution but for 0.6M potassium silicate solution some peaks show amorphous structure.

The occurrence of these phases indicate that the substrate and the solution both contribute to forme the anodic film.

a

b
c

 XRD spectra of 30 minutes anodized specimens (a) 3M potassium hydroxide electrolyte  (b)1M sodium silicate electrolyte  (c) 0.6M potassium silicate electrolyte.

Film thickness measurements

Figure (4.4) shows the variation of film thickness with time using the three different electrolytes 3M potassium hydroxide, 1M sodium silicate, and 0.6M potassium silicate electrolytes. The film thickness for the three solutions increases with the anodizing time rapidly in the first 30 minutes with a slow rate after 30 to 40 minutes. This behavior is due to the increase in the thickness of the anodized layer acting as barrier to the flow of current which decreases the rate of oxidation of magnesium.


Effect of anodizing time on film thickness by using 3M potassium hydroxide, 1M sodium silicate, and 0.6M potassium silicate electrolytes at a constant voltage.

From the results, the optimum deposition time used to obtain maximum thickness was 30 minutes for 3M potassium hydroxide, 1Msodium silicate, 0.6M potassium silicate electrolytes.

The thickness of the anodic film changed according to the type of the electrolyte figure(4.5). The average thicknesses of formed anodic films which achieve the lowest corrosion rate  of 3M potassium hydroxide, 1M Sodium Silicate and 1M Silicate  were measured using an optical microscope and Posi Test DFT Combo are  47 µm, 26 µm, and 48 µm respectively. Films produced in the 0.6M potassium silicate electrolyte were the thickest in comparison with  those  produced in 3M potassium hydroxide solution and 1M Sodium Silicate electrolytes for the same volt 5V.

                                                                  a

b
c

The film thickness of 30 minutes anodized specimens using(a)3M potassium hydroxide electrolyte (b)1M sodium silicate electrolyte (c) 0.6M potassium silicate .

Surface Morphology and EDX results

Figure(4.6 -a) shows the SEM for unanodized polished specimens. The surface morphology of the anodic film figure (4.6 -b) reveals a homogenous distribution of oxides produced in the KOH electrolyte. It contains dark spots which indicate the anodizing process deposited the oxides MgO on the surface of the metal. No cracks were observed in the anodized layer. Film produced in sodium silicate solution in figure (4.6 -c) shows a heterogeneous structure with microcracks in the outer layer of the film. Some domains of the anodized layer have amorphous structures and others have ordinary one.  It was observed that the Layer produced in potassium silicate solution has more domains of amorphous structures than those produced in the layer of sodium silicate solution. The layer consists of a mixture of both amorphous and ordinary domains causes more micro-cracks on the outer layer on the surface figure 

                                                                       a


                                                                       b


                                                                        c


                                                                      d

Surface morphology and spectrum analysis of (a)pure magnesium (b)30minute anodized specimen in 3MKOH electrolyte (c)30mintes anodized specimen in 1M sodium silicate electrolyte (d)30minutes anodized specimen in 0.6M potassium silicate electrolyte.

Microhardness measurements

Shore hardness test indicates that the microhardness for the produced film using 3M potassium hydroxide, 0.6M potassium silicate, and 1M sodium silicate solutions are 97(85.6RHN), 88(83.4RHN), and 99(86RHN) respectively.

Film adhesion testing  

The analysis of the anodic obtained film layers showed that they contain Mg- MgO – Mg2SiO4. This indicates that the metallic substrate has diffused into the anodized film layer resulting in further enhancement of the adhesion. Adhesion was measured according to ASTM D 3359 method 13, thickness <125 µm. The adhesion of the anodic films is classified as 3B which denote that the amount of the layer released  by the adhesive tape lies from 5-15% of the formed layer.

Mechanism of the anodizing process:

  Mechanism of the anodizing process could be explained as dissolution and oxygen evolution process. Anions in the electrolyte first need to reach at the anode/electrolyte interface and then enter into anodic coatings.

The general reactions using 3M KOH solution in anodizing process for Mg are as follows:

Mg → Mg+2 + 2e-                   (1)

4OH-→ O2↑+ 2H2O +4e-       (2)

Mg+2 + 2OH →Mg(OH)2       (3)

Mg(OH)2 → MgO + H2O       (4)

The  general reactions occurring in the anodizing process using 1mole sodium silicate and 0.6-mole potassium silicate for Mg is as follows

 Mg → Mg+2 + 2 e-  (1)

 4OHˉ → O2 ↑ + 2H2 O + 4 e-   (2)

  Mg+2 + 2OHˉ → Mg(OH)2          (3)

  Mg(OH)2 → MgO + H2O      (4)            

 Mg(OH)2 + SiO2 → Mg2SiO4 (2MgO.SiO2)    (5)

During the oxidation process, the Mg ions, produced by reaction(1) combine with the OH- in the electrolyte solution to form Mg(OH)2 and Mg2SiO4(2MgO.SiO2) reactions(3) and (5) , respectively. The hydroxides change to oxide compounds by the dehydration process, reaction(4). The film formation processes, reactions(3),(4), and(5) may be promoted by a high concentration of the electrolyte, containing more SiO2 and OH- ions.

Conclusions

·      The corrosion rate of pure magnesium  decreases from about 37 mpy to be 7, 2,1.4 mpy  with efficiency of 81% , 93.84% , 96.25%  for 30 minutes anodized specimens using   3M potassium hydroxide,1M sodium silicate, and 0.6M potassium silicate electrolytes respectively.

·      Safe electrolytes (sodium silicate and potassium silicate ) used have shown better corrosion resistance than using unsafe electrolytes (potassium hydroxide).

·      XRD diffraction & EDX confirms that for 30 minutes anodized specimens the film is mainly consists of magnesium oxide using 3M potassium hydroxide electrolyte and mainly consists of magnesium silicate Mg2SiO4 with a partially amorphous structure using 1M sodium silicate and 0.6M potassium silicate. 

·      The contact angle  of  pure magnesium changed from 700 (hydrophilic) to  114o,105o,113o  (hydrophobic) for 30 minutes anodized specimens using 3M potassium hydroxide, 1M sodium silicate, and 0.6M potassium silicate electrolytes respectively.

·      Film thickness reaches  48, 26, 47µm for   30 minutes anodized specimens in 3M potassium hydroxide, 0.6M potassium silicate, and 1M sodium silicate electrolytes respectively. 

·      Hardness of the anodic films have increased from 38 to 85.6, 83.4, and 86 RHN for 30 minutes anodized specimens in 3M potassium hydroxide, 0.6M potassium silicate, and 1M sodium silicate electrolytes respectively.

·      According to ASTM D3359 method 13 for thickness <125 µm .The adhesion of 30 minutes anodic films using the three electrolytes are classified as 3B which denote that the amount of the layer released  by the adhesive tape lies from 5-15% of the formed layer.


Monday, August 23, 2021

Preparing large single crystal of metals .

Methods to prepare a large single crystals of metals  has two main ways :

1- Solidification from the melt .

2- Grain growth in the solid state .

1- solidification from the melt :

Czochralski method :
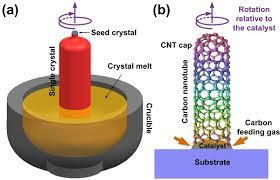
A seed crystal is gradually withdrawn vertically from the surface of a molten metal leads to building a crystal rod with an orientation to the seed and the crystals produced are irregular in the cross section and this result in no contact with the mould , so contamination is reduced. This technique is used to produce germanium and silicon crystals for transistors . It's very useful for silicon which is very reactive at the melting point 1412 degree centigrade . 


Figure 1 : Czochralski method , modern single crystal growing apparatus.

The crystal rod is rotated to ensure uniform cross section and to get homogeneity in the dispersion of the alloying elements. The orientation of the resulting crystal is controlled by a seed crystal of the required orientation . 
In the Bridgeman method , the metal content is lowered through a vertical furnace with a temperature gradient and the crystal is nucleated at the end and grows upward in the content . the metal content i.e. the mould made from pure graphite when using factory metals such as Aluminum , copper , silver , nickel. .But low melting point metals such as tin ,zinc and cadmium are grown up in heat resisting glass tubes . Metals which react with carbon alumina is used .

figure 2 Bridgeman furnace .
Single crystals can be produced in horizontal furnaces and the mould is graphite . 
Another method is the application of the zone melting technique where a molten zone is moved from one end of the bar to another which is also a method of purification .
Crystals can also be produced vertically by the floating zone method in which the metal is not in contact with a container using cold grips to hold the specimen and a molten zone is produced by high frequency heating or electron bombarding from a filament in a high purity argon atmosphere or good vacuum the length of the zone being proportional to the square root of the surface tension to the  square root of the density of the metal  this method is used in high melting point metals like  tungsten, tantalum , molybdenum ,vanadium , nickel , rhenium , etc. 

Grain growth in the solid state:
The most widely used method is the strain-anneal technique.
A fine grained annealed specimen is is strained by 1- 2 percent in tension then annealed at a gradually increasing temperature. Nucleation and growth of a few and often one grain and this grain absorb all strains during annealing . In this way single crystal rods of aluminum and some of its alloys can be grown up to 50 cm long by a temperature gradient 20 degree per one cm for pure aluminum and for some aluminum alloys 1000 degree per cm . Most metals which has phase transformation producing single crystal by slow cooling through the transformation like iron , titanium , uranium and zirconium .

See


Thursday, September 24, 2020

Corrosion Inhibition of Magnesium by anodizing in safe and unsafe electrolytes :#corrosion inhibition#

Corrosion Inhibition of Magnesium by anodizing in safe and unsafe electrolytes :
to view the article click on the following link below .
#corrosion#Magnesium#Anodizing#
#Anodizing#


Full corrosion course best explanation